


Generate a technology report
Generate a number of different reports measuring the efficiency of your WiFi and how is it accessed. This is useful for understanding peaks in WiFi access.
To generate a technology report, follow the steps below:
1. Select ![]() Reports from the left hand menu
and click Technology.
Reports from the left hand menu
and click Technology.
A number of graphs are displayed for you:
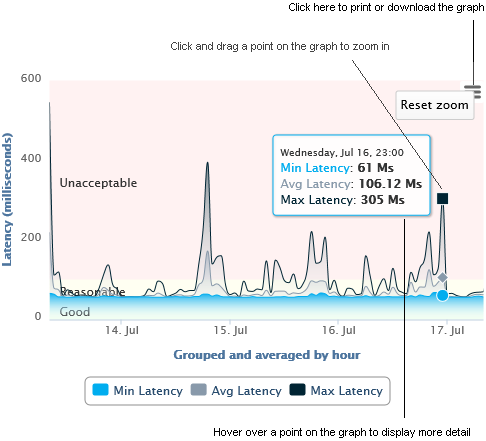
 Gateway Latency.
Latency indicates the time lapse between the action and reaction of your
WiFi service. A consistently high spike in the graph is an indication
that a hardware issue may need to be addressed.
Gateway Latency.
Latency indicates the time lapse between the action and reaction of your
WiFi service. A consistently high spike in the graph is an indication
that a hardware issue may need to be addressed.

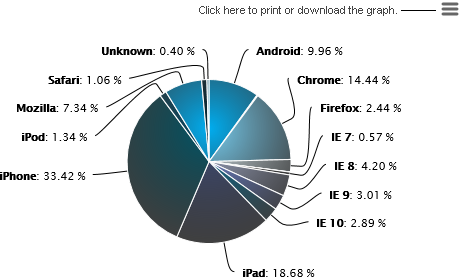
Browser Usage. Shows the usage of each web browser
over a selected period.
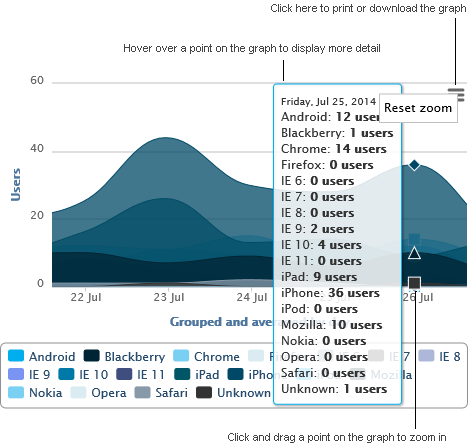
Browser Trends. Shows the number of guest users using
each web browser over a selected period.
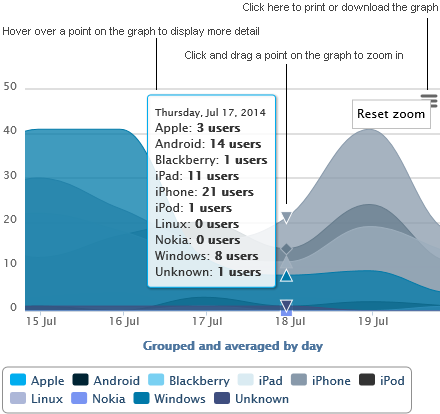
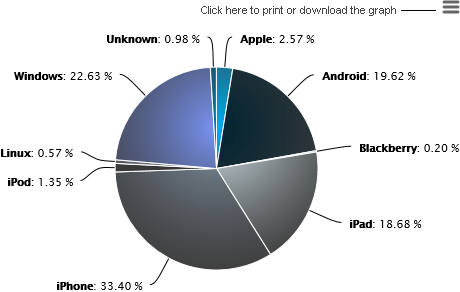
Operating Systems Trends. Shows the number of guest users using
each operating system over a selected period.
Operating Systems Usage. Shows the usage of each operating system
over a selected period
Data Transferred. Approximate volumes of data downloaded
and uploaded across all active gateways for your selected site, company
or estate.
2. Enter a date range in the top right of the screen, use either:
 Date
series and select to display data from the current year, month
or week.
Date
series and select to display data from the current year, month
or week.
-or-
Choose
a date range to display data for a specific range of dates. Click
in the From and To
fields and use the pop up calendar to select your dates.
3. Click Go to display the dates selected.
4. Adjust the reports displayed to suit you (this is not available in all reports):
Click and drag
on a report to zoom in on the information displayed.
Hover over a point
in the report to display more detail.
5. Click  and choose to print or download each chart in your preferred format.