


Understanding the MyAirangel Dashboard
The ![]() Dashboard
screen displays when you select an estate to work with.
Dashboard
screen displays when you select an estate to work with.
The  Dashboard screen
provides information on:
Dashboard screen
provides information on:

 Each
site in your estate. Your estate
is set up for you. A map is displayed indicating the number of logged
in guest users at each
site in your estate. Hover over site locations in your estate map to display
the network health of each site.
Each
site in your estate. Your estate
is set up for you. A map is displayed indicating the number of logged
in guest users at each
site in your estate. Hover over site locations in your estate map to display
the network health of each site.
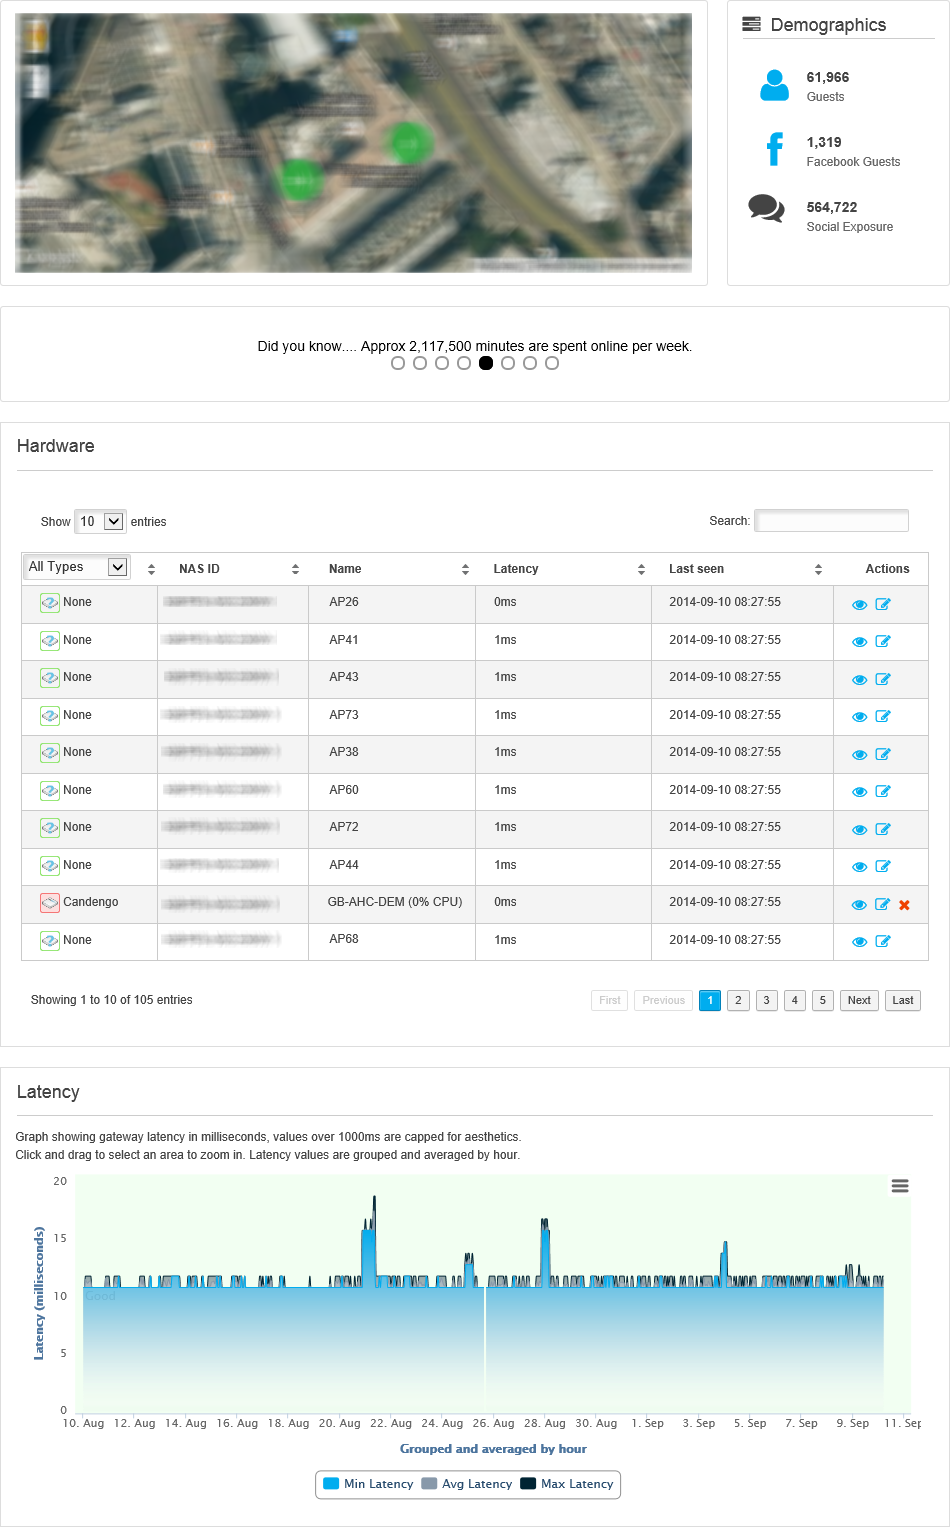
Guest
demographics. An overview of WiFi
guest user statistics is displayed. Hover over each heading listed for
more detail.
Quick view statistics. A
feed of statistics scrolls across the Dashboard.
This provides a useful overview of WiFi usage statistics, such as your
busiest day.
Network
hardware health. Displays the health of network equipment, such as
the CPU of each gateway.
Gateway
latency. A graph displays the gateway latency.
This is useful for identifying problems with bandwidth, etc.